Stakeholder Management Implementation Part 5: Meaningful Metrics
A Quick Overview of What You Need to Know
Macro Metrics
Micro Metrics
Return on Investment Calculations
Click here for links to information about EEA sponsors; here to subscribe to ESM weekly; here for an ESM media kit.
A dirty little secret in both people management and marketing is the lack of meaningful metrics comparable to those used in other parts of general management to measure financial results, investments, processes, outcomes, and/or return on investment. This is not necessarily for a lack of desire, but rather because many executives have doubts about the ability to measure the impact of human activities on the bottom line, especially because almost nothing about people assets appear directly on profit and loss statements or balance sheets.
As a result, providers of recognition, incentive, learning, survey, and other people solutions often talk about enhanced loyalty, morale, reduced turnover, etc., but rarely provide concrete metrics substantiating any actual value created. With so many tools now available to better evaluate value creation in business, the lack of concrete substantiation of any results will become increasingly suspect.
A Quick Overview of What You Need to Know 
The purpose of metrics in management is almost no different from their use in sports. Of course it’s important to track the results. Equally important is to understand the identifiable actions that lead to the desired results. These are principles ensconced in the world of total quality management as well. By correlating outcomes with actions, management and teams can better identify how to improve outcomes moving forward. Metrics are also used in both voluntary and new regulatory disclosures coming to big companies and their supply chains even in the US, as result of the European Union Corporate Sustainability Reporting Directive that will also affect suppliers of US firms subject to the laws.
Note: these EU laws possibly will become part of tariff negotiations with the new US administration, some of whose supporters have called a form of tariff.
Metrics and human capital analytics sound complex, and at large organizations that can be the case. That said, the world of human capital management and total quality management have come up with several basic macro-metrics for organizations and micro-metrics for specific departments and initiatives that require nothing more than basic mathematics and spreadsheet functions that can be used for almost any size organization.
Among the basic concepts to master in measurement and metrics is the difference between objectives and key results (OKRs) and key performance indicators (KPIs.) OKRs are a more balanced approach to measurement in that they take into account both the factors that contribute to success and the results themselves. KPIs focus more narrowly on the results.
Macro metrics apply to the entire organization: that is the metrics representing the fulfillment of its overall purpose, goals and objectives for a given period, consistent with its values. These metrics are contained in voluntary ISO 30414 human capital management standards. Similar metrics appear in European Union Corporate Sustainability Reporting laws that apply to all US companies that do more than about $44 million sales in the EU, have 200 or more employees, or reach certain balance sheet thresholds.
The Europeans have introduced a new element to qualitative measurement that specifically focuses on the risks and opportunities created by any venture known as double materiality. This process asks organizations to assess any risks that its products, services, policies or actions might create for any stakeholder or shareholder, along with policies to mitigate the results, metrics used, and progress. The double materiality includes also the opportunities created by the enterprise, along with steps taken to capitalize on them, metrics used and strategies to optimize them. This process enables management, investors, and other relevant stakeholders to anticipate factors that could create costs and risks down the line or in turn new sources of value creation.
While macro metrics are used to evaluate the entire organization, micro metrics apply to a specific department, team, or project within the organization. When possible, they should harmonize with the purpose, goals, objectives, and values of the organization, unless of course they are focused on a specific initiative, such as a new product development project or launch. The general goal of metrics in business is to track not only the desired results but the actions which, if done more or more effectively, are most likely to lead to further improvement.
Macro Metrics
These metrics help organizations detect trends related to customers, employees, supply chain and distribution partners, and even communities, that could portend future financial setbacks or improvements. Simply put, these metrics are intended to track those human capital factors that could enhance future results or signal performance declines.
Given that each category of stakeholders makes a different type of contribution to the bottom line or value creation, there are some slight variations in metrics used. Below are some of the metrics used with a high probability of signaling outcomes or providing prescriptive analytics. Based on the category of stakeholders, these metrics can include:
- Revenues and profits per employee, customer, or distribution partner.
- Employee and customer ROI and value added, calculations of the return on investment of employee and customer investments and of the value they add to the organization.
- Costs per employee, customer, or distribution partner.
- Willingness to refer, measured ideally by actual referrals but also by surveys.
- Level of engagement or sense of appreciation, generally measured through surveys.
- Number and cost of accidents, defects, recalls, lawsuits.
- Gender, age, ethnicity, length of service.
- Level of training organized by category of workforce and demographics.
- Percentage of employees recognized for performance or service; percentage of customers actively participating in a loyalty program.
- Percentage of products/services supplied by vendor by length of time.
- Percentage of products/services sold by distribution partners measured against their participation in training and/or incentive and promotion programs.
- Bench strength: succession plans for key employees.
Advanced analytics can help correlate these factors to view more granularly where new value can be created or risks avoided. Prescriptive analytics go one step further to point out potential risks or opportunities should current trends continue.
Micro Metrics
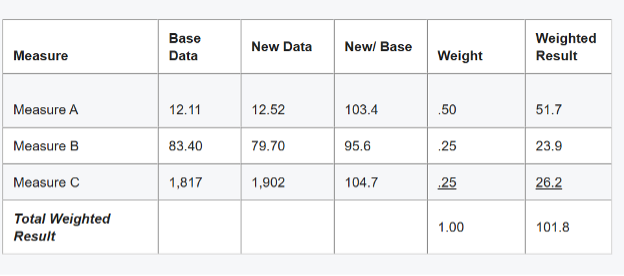
For any type of more specific performance improvement, the Master Measurement Model is a statistical process control frequently used in total quality measurement. It was developed by the American Productivity and Quality Center for the Incentive Research Foundation in the early 2000s. Its framework is more like an OKR than a KPI in that it attempts to measure outcomes against the key processes used to achieve them. Moreover, this optional step creates a weighting system to account for the relative impact of different actions. For instance, a sales engagement campaign might give a 50% weight to the achievement of the goal, a 25% weight for successfully participating in a sales training program, and a 25% weight for mentoring another salesperson to successfully achieve his or her goals.
This report shows that the team or individual exceeded the results goal. Because of the importance of achieving the desired results, the score is weighted. For measure B, the individual or team failed to achieve the goal. In this case, their weighted score is lowered. For measure C, the individual or team exceeded the score, so the weighted results are correspondingly higher.
Generally speaking, micro-metrics should include three to no more than five factors, with one or two results measures and no more than two or three process measures—actions, which taken more of, help contribute to results. For a service technician, that might include a measure of successful service calls plus a measure for referrals for upgrades or new products and services. For delivery drivers, that might include a measure for number of deliveries per day weighed against an accuracy and safety metric.
Sometimes, the only reason to weigh scores is for use in developing incentive or reward programs to encourage not just a focus on results but on the steps to success.
The metrics should be designed to better pinpoint the actions that lead to desired results. In the case of the sales example, if Measure B was intended to contribute to the sales gain, the results suggest that it did not, since performance in that category fell. On the other hand, Measure C showed an improvement, suggesting that future efforts may wish to invest more in that activity.
For return on investment purposes, it helps to estimate the value not only of results but also of the actions taken to better see if the cost was justified, and also to determine the value of awards or gainsharing to be provided to participating stakeholders.
Return on Investment Calculations 
One of the greatest challenges in the realm of people is calculating the return on investment of training, incentive and recognition, communications, meeting, or other programs.
Macro metrics enable management to get an overall view of the relative effectiveness of people investments. Calculating human resources and marketing ROI and value add using standardized formulas; tracking referrals or willingness to refer; tracking cost per employee, customer, and distribution provider; identifying cost to replace employees or customers, etc. provide a snapshot of relative management or marketing effectiveness but do not pinpoint the impact of specific initiatives.
Micro metrics enable organizations to better track the impact of specific initiatives, by establishing an estimated value of the initiative to the organization against the costs. If someone wishes to propose an investment of any kind in time or money in an initiative, it should be accompanied with an estimated value to the organization, financial or otherwise. Value is not always measured in financial terms, but sometimes on whether the results otherwise support the purpose, goals, objectives, and values of the organization.
Enterprise Engagement Alliance Services
 Celebrating our 15th year, the Enterprise Engagement Alliance helps organizations enhance performance through:
1. Information and marketing opportunities on stakeholder management and total rewards:
- ESM Weekly on stakeholder management since 2009. Click here to subscribe; click here for media kit.
- RRN Weekly on total rewards since 1996. Click here to subscribe; click here for media kit.
- EEA YouTube channel on enterprise engagement, human capital, and total rewards since 2020
 Management Academy to enhance future equity value for your organization.
3. Books on implementation: Enterprise Engagement for CEOs and Enterprise Engagement: The Roadmap.
4. Advisory services and research: Strategic guidance, learning and certification on stakeholder management, measurement, metrics, and corporate sustainability reporting.
5. Permission-based targeted business development to identify and build relationships with the people most likely to buy.
Contact: Bruce Bolger at TheICEE.org; 914-591-7600, ext. 230.