EEA Creates an EEI High Growth Portfolio to Test People Link to Share Price Performance
 The Enterprise Engagement Alliance has launched the Enterprise Engagement Index to help investors and management use easily available financial and head-count information to measure how well companies create value through people. Although not created as a tool to predict future share price performance, this mock ETF (Exchange-Traded Fund) was created to test over time whether a potential connection exists over a three-year time frame between the efficiency of value creation through people and stock market performance.
 The 2012-2018 Engaged Company Stock Index
The Basis for This Stock Performance Experiment
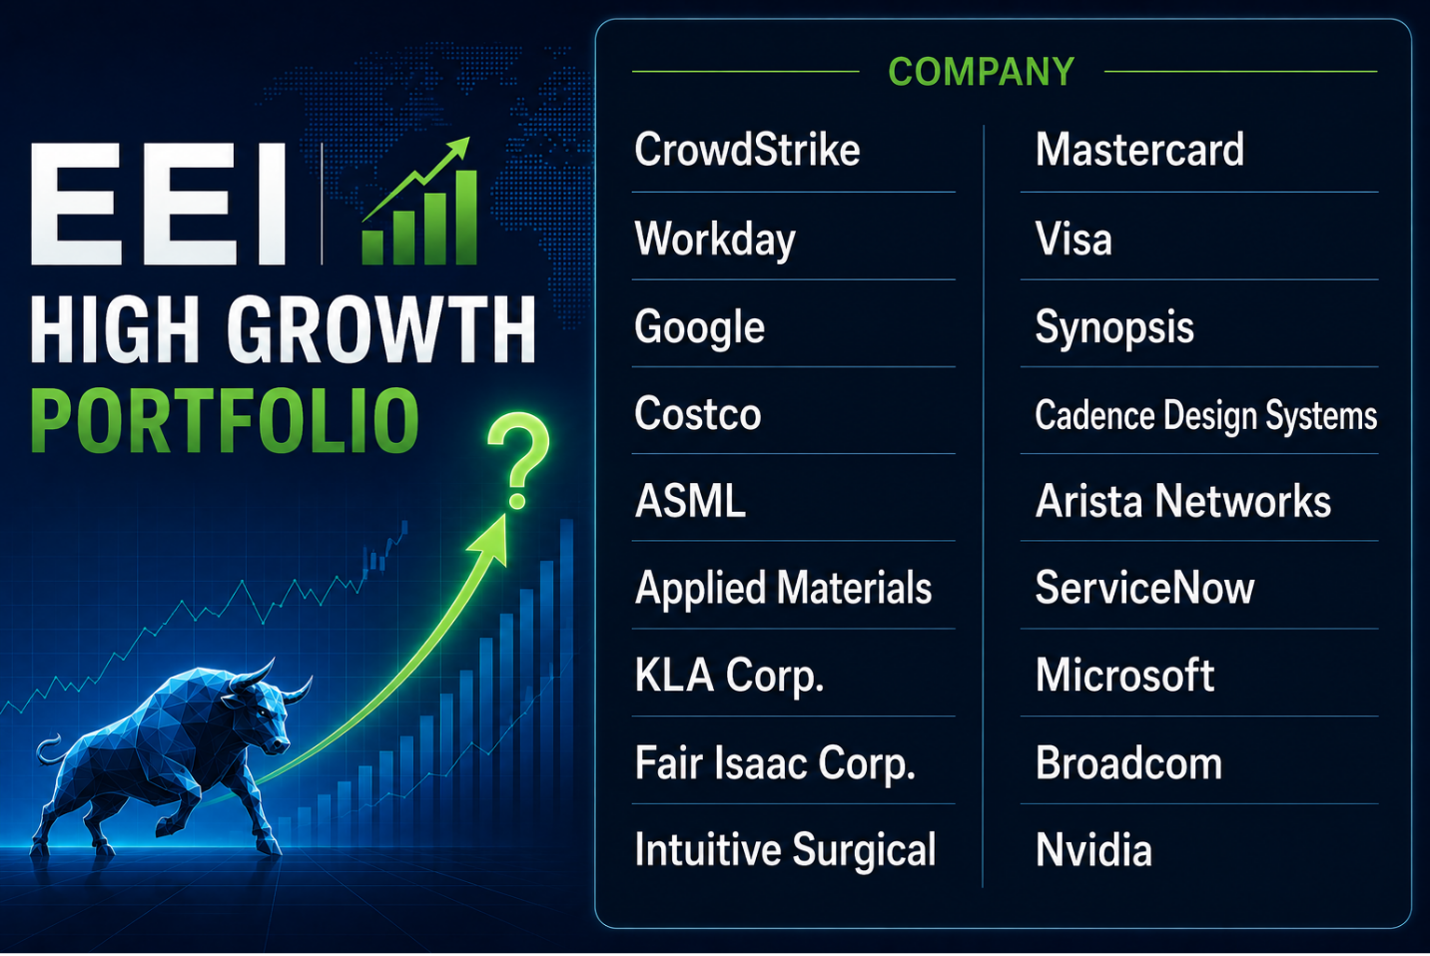
The EEI High Growth Portfolio
Do organizations that effectively create value through people have an advantage on the stock market over time? To find out, the Enterprise Engagement Alliance has created a mock ETF using the Enterprise Engagement Index methodology to see how well it works as a tool to predict future equity performance over a three-year period.
Although the EEI HIgh Growth Portfolio is designed for longer-term investors, the EEA will publish a weekly update on the performance of the fund on its ESM weekly newsletter each week in the following format:
EEI High Growth Portfolio
Objective: Outperform the S&P 500 over three years
Launch: June 5, 2026
EEI: $10,668
S&P 500: $679
June 10, 2026
EEI: $11,009, +3.19%
S&P 500: $667.05 -1.57%
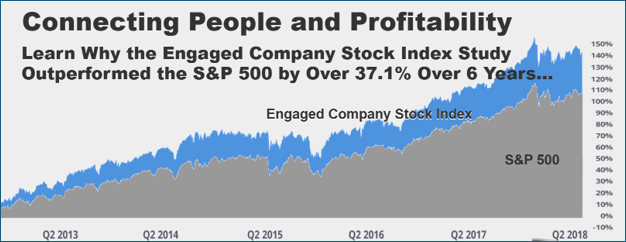
The 2012-2018 Engaged Company Stock Index
The EEI Stock Index is based on a similar premise as the original Engaged Company Stock Index, also a mock ETF created by the Enterprise Engagement Alliance. Based on the Good Company Index the McBassi & Co. analytics company published at that time and managed by Dan McMurrer, the company’s Chief Analyst, it consistently outperformed the S&P over six years, accumulating to 37.1% upon its completion--a level of performance many investors would be happy to consistently generate. Click here for the portfolio.
Unlike other stock studies that have looked back over time to establish correlations between effective people management and stock results, the ECSI was a longitudinal study that tested the hypothesis with actual ongoing results. The previous performance of the stocks was not a factor in their selection.
In 2018, Goldman Sachs launched its JUST Capital ETF, which similarly is based on in the annual survey data of JUST Capital, a stakeholder capitalism advocacy firm, on factors that matter most to Americans, including the interests of workers, customers, and the environment. It too has generally outperformed its benchmark, the Russell 1000.
Similarly, this new EEI High Growth Portfolio is designed to test the extent to which effective management of customers and employees contributes to future profitability and stock market performance. Based on readily available information for publicly held companies and for investors and management of privately held firms, the EEI uses a transparent formula anyone can use to objectively score industries and companies on their ability to create value through people. Click here for complete details as well as a growing list of industry and public company reports.
Important note. The EEI High Growth Portfolio is a hypothetical portfolio created solely to test whether companies scoring highly on the Enterprise Engagement Index demonstrate any tendency to outperform relevant market benchmarks over time. It is not intended as investment advice, a recommendation to buy or sell securities, or a prediction of future stock performance. The EEA has no financial interest in the success or performance of this experiment. Many other factors affect stock market performance, including a company's financial stability, reputational risks, debt, economic or geopolitical factors, unforeseen competitive factors, and the timing of the individual stock purchases.
The Basis for This Stock Performance Experiment
The objective of this research is to determine whether companies scoring highly on the EEI methodology exhibit any statistically meaningful relationship
 with future share-price performance relative to the S&P 500. The EEA used the initial analyses of over 80 companies to identify the factors most consistent with outperformance of the S&P 500 and then applied that criteria to identify a basket of 18 stocks selected out of the sectors with the best business models for high performance.
 The companies selected were not based on past stock price performance but rather on the EEI selection criteria detailed below.
Because the idea is to test the model over three years, the portfolio will not be changed throughout the period. The sole benchmark as of launch will be the S&P 500, but others may be added later, such as more comparable customer and employee satisfaction data.
Using basic statistical process controls, but limited to objective financial and head count information, the EEI has identified five employee and customer factors that can be transparently measured by any company. It has created a weighting scale for each factor based on the relative amount of investment in employees and customers as well as availability of reliably comparative public data. For instance, because many companies do not report labor costs in comparable manners, it is often difficult to compare HCROI data between even public companies in the same industry.
Each company receives a score on a 20-to-100 scale that is deliberately not weighted by type of company. This gives a big advantage to companies with a business model providing high profits per employee and customer satisfaction (measured by sales growth) over the many industries with business models affording relatively low profits per employee and slower sales growth.
In addition to the financially based EEI score, the EEI reports also include (for comparability purposes only) employee and customer satisfaction information such as Glassdoor or ACSI (American Customer Satisfaction Index) or other comparable data when available. This can be correlated with stock market performance or whatever data an organization seeks to correlate. None of these factors are included in the EEI score.
After running multiple tests, the EEI arrived upon the following criteria and weights for assigning EEI scores:
- Revenue per employee (20%)
- Profit per employee (30%)
- Human Capital ROI (10%)
- Profitability to net income (net income ÷ revenue) (10%)
- CARG (compounded annual revenue growth) over three years (30%)
| Enterprise Engagement Index Factors | Correlation with Stock Performance vs. S&P 500 |
|---|---|
| Revenue Growth + Profit per Employee | 0.48 |
| Three-Year Revenue CAGR (compounded growth) | 0.39 |
| Profit per Employee | 0.39 |
| EEI Score | 0.32 |
| Operating Margin | 0.06 |
| Revenue per Employee | 0.03 |
| HCROI | 0.13 |
The implications. Interestingly, if this is correct, the analysis suggests that the best candidates for alpha stock performance are not necessarily the highest-margin companies, but rather companies that combine strong revenue growth, with high profit per employee, high productivity, scalable business models, and strong EEI scores.
The EEI identifies a somewhat counterintuitive conclusion: High margins alone are not particularly predictive of stock market performance (0.06); HCROI by itself is only modestly predictive (0.13) partly because of inconsistencies of how necessary data is publicly reported, and revenue per employee alone is almost irrelevant.
The strongest signal for stock performance appears to center on a company's ability to simultaneously grow revenue rapidly while generating increasing profit per employee.
That favors: software, semiconductor tools, payment networks, and asset-light platforms. It tends to penalize banks, utilities, telecoms, traditional retailers, and especially labor-intensive businesses. This means that for meaningful comparisons, users of the EEI should compare companies within industry sectors.
Because the test is specifically designed to support a high-growth portfolio, the criteria is weighted to industries with business models enabling much higher profits per employee and customers than labor-intensive fields. These labor-intensive fields require much more effective management and engagement to achieve higher profitable because of high fixed costs and lower revenues per employee.
As a result, the stocks selected represent:
- 35% semiconductors/AI infrastructure
- 25% enterprise software
- 20% payment networks
- 10% medical technology
- 10% high-EEI scoring consumer leaders (such as Costco)
The EEI High Growth Portfolio
Here is the EEI High Growth Portfolio based on one share per company as of June 5, 2026, with a three-year investment objective. This is not designed for day-traders or people trying to time the market. This chart will be updated at least quarterly and will include a comparison with its benchmark, the S&P 500.
The mock portfolio is valued at $10,668.95 as of June 5, 2026.
| Symbol | Name | June 6, 2026 | Sept. 30, 2026 |
|---|---|---|---|
| CRWD | CrowdStrike | 671.02 | |
| WDAY | Workday | 144.28 | |
| GOOGL | 368.53 | ||
| COST | Costco | 971.87 | |
| ASML | ASML | 1,641.74 | |
| AMAT | Applied Materials | 453.01 | |
| KLAC | KLA Corp. | 1,929.20 | |
| FICO | Fair Isaac Corp. | 1,137.33 | |
| ISRG | Intuitive Surgical | 422.06 | |
| MA | Mastercard | 491.08 | |
| V | Visa | 323.57 | |
| SNPS | Synopsis | 464.85 | |
| CDNS | Cadence Design Systems | 376.19 | |
| ANET | Arista Networks | 154.27 | |
| NOW | ServiceNow | 112.45 | |
| MSFT | Microsoft | 416.67 | |
| AVGO | Broadcom | 385.73 | |
| NVDA | Nvidia | 205.10 |
Disclaimer: The Enterprise Engagement Index and the EEI High Growth Portfolio are educational and research tools designed to explore potential relationships between publicly available measures of organizational performance, stakeholder management effectiveness, and long-term business outcomes. No proof exists that this experiment will yield results in excess of the S&P 500, its objective.
The portfolio is hypothetical and is maintained solely for analytical purposes. Neither the Enterprise Engagement Alliance nor its affiliates are registered investment advisers, broker-dealers, or securities analysts. Nothing in this report should be construed as investment, legal, accounting, tax, or financial advice, or as a recommendation to buy, sell, or hold any security.
The inclusion of any company in the EEI High Growth Portfolio reflects only its score under the EEI methodology at the time of selection on June 5, 2026 and does not imply that the company is expected to outperform the market or that it is suitable for any investor. All investments involve risk, including the possible loss of principal. Readers should conduct their own due diligence and consult qualified financial professionals before making any investment decisions.
Enterprise Engagement Alliance Services
 Celebrating our 17th year, the Enterprise Engagement Alliance helps organizations enhance performance through:
1. Information and marketing opportunities on stakeholder management and total rewards:
- ESM Weekly on stakeholder management since 2009. Click here to subscribe; click here for media kit.
- RRN Weekly on total rewards since 1996. Click here to subscribe; click here for media kit.
- EEA YouTube channel on enterprise engagement, human capital, and total rewards since 2020
 Management Academy to enhance future equity value for your organization.
3. Books on implementation: Enterprise Engagement for CEOs and Enterprise Engagement: The Roadmap.
4. Advisory services and research: Strategic guidance, learning and certification on stakeholder management, measurement, metrics, and corporate sustainability reporting.
5. Permission-based targeted business development to identify and build relationships with the people most likely to buy.
Contact: Bruce Bolger at TheICEE.org; 914-591-7600, ext. 230.